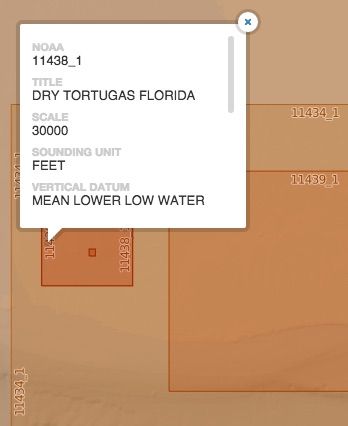
Feet units
for onshore nautical charts
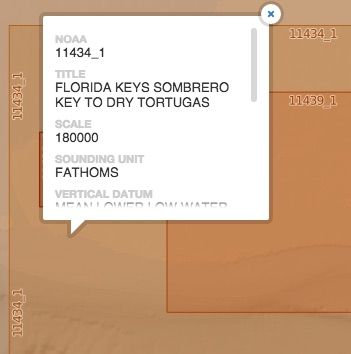
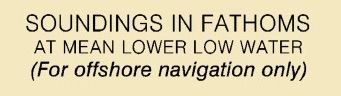
Fathoms units
for offshore nautical charts
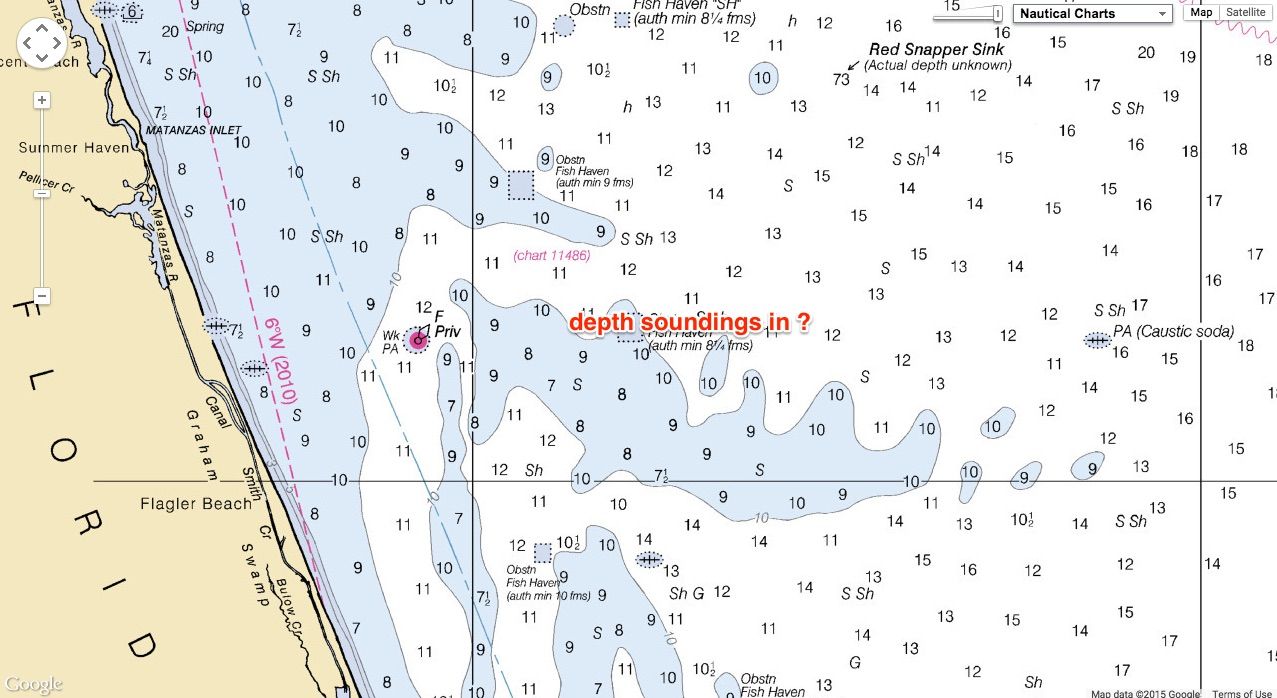
Numbers printed on the water areas of the chart indicate the depth of the water at that spot.
However, a 3 on the chart might mean three feet, three fathoms, or three meters.
So it is important to know which unit of measurement is used.
On the GeoGarage platform, the units are readable with the help of the NOAA layer coverage.
We already discussed of the soundings for the NOAA raster charts layer in a previous post.
Depths (also called soundings) are shown in either feet, fathoms (6 feet), or meters (3.28 feet).
Subscripts, such as 52, show depths in fathoms and feet (5 fathoms and 2 feet) or decimal meters (5.2 meters).
Note : in the case of SOUNDINGS IN FATHOMS AND FEET, a fathom, by the way, is six feet, so on a chart with soundings in fathoms, a number such as 03 means zero fathoms and three feet.
In the catalogue of NOAA nautical charts, we have :
- FEET —> 1547 charts
- FATHOMS —> 362 charts
- FATHOMS AND FEET —> 214 charts
- METRIC —> 42 charts
- FEET TO 30FT CURVE —> 3 charts
- FATHOMS AND FEET TO 11 FATHOMS —> 2 charts
In 1992 U.S. charts began switching from feet and fathoms to soundings in meters.
If you haven't made that switch yet, you can divide soundings in meters by 0.3 to get the approximate depth in feet. But as you can see, only 42 charts are in meters today.
Note : from the U.S. Chart No. 1, 12th ed. April 15, 2013 Section I - Depths, No. 10 on pg. 43 : "Sounding in true position (NOAA shows fathoms and feet with vertical numbers and meters with sloping numbers)"
|
However, all depths indicated on nautical charts are reckoned from a selected level of the water called the sounding datum (sometimes referred to as the reference plane). For most NOAA charts of the U.S. in coastal areas, the sounding datum is Mean Lower Low Water (MLLW), which is the average depth at the lower of each day's two low tides. Depths shown on charts are the least depths to be expected under average conditions. Since the chart datum is generally a computed mean or average height at some state of the tide, the depth of water at any particular moment may be less than shown on the chart. Measurements at this level help boaters determine the closest underwater clearance possible for their boat.
However, when the tide table shows a negative low-tide entry, actual depths will be less than the chart indicates. When the depth of the water is a concern, you will need to know the height of the tide.
|


Charted depths and drying heights on nautical charts are given relative to chart datum.
Some height values on charts, such as vertical clearances under bridges or overhead wires, may be referenced to a different vertical datum.
Note : other local vertical datum are used especially for lakes :
- MEAN LOWER LOW WATER ---> 1560
- GREAT LAKES LOW WATER ---> 527
- COLUMBIA RIVER DATUM ---> 34
- NORMAL LAKE LEVEL - FRANKLIN D. ROOSEVELT LAKE ---> 11
- LOW LAKE LEVEL - LAKE CHAMPLAIN ---> 6
- LOW WATER DATUM IS 569.2 FEET IGLD (1985) FOR LAKE ERIE ---> 6
- SACRAMENTO RIVER - SACRAMENTO TO OLD FERRY ---> 5
- HUDSON RIVER DATUM ---> 4
- LOWEST NORMAL TIDES ---> 3
- LOW WATER DATUM IS 243.3 FEET IGLD (1985) FOR LAKE ONTARIO ---> 3
- NORMAL POOL LEVEL - CAYUGA & SENECA LAKES ---> 3
- UNDETERMINED ---> 3
- LOWEST NORMAL LOW WATER ---> 2
- MEAN LOW WATER ---> 2
- LOW WATER DATUM IS 577.5 FEET IGLD (1985) FOR LAKES MICHIGAN AND HURON —> 1